Special Issue - Science communication: Making research accessible - Data stories to open up science - December 2025
The words we use to reach our audiences matter. The Varthai – Data Stories website uses art, poetry, and data visualisation to spark curiosity and increase the accessibility of research by finding words that speak to different groups. Digging deeper into these data stories, audiences can explore the methods used to draw insights from the data.
Academia, official statistics, and back again
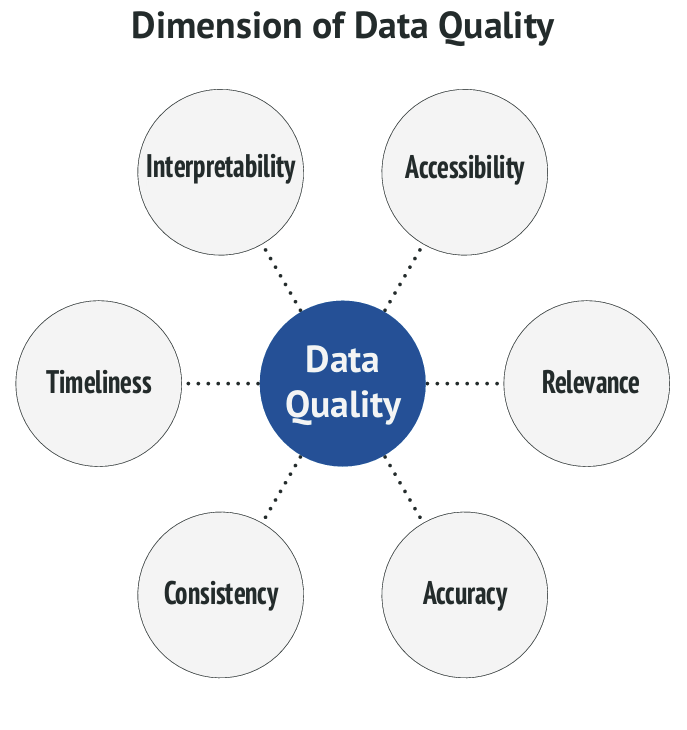
I left academia in 2013 to become a methodologist in official statistics. Here, I learned how deeply public trust hinges on more than just precise numbers. To ensure that data were relevant and usable for policymakers and communities alike, national statistics offices implemented practices grounded in key data quality dimensions: accessibility, relevance, consistency, accuracy, interpretability, and timeliness (Brackstone, 2008).
This meant more than publishing reports; it involved press releases, interactive visualisations, open APIs, and collaboration with community representatives to ensure outputs served real needs. Importantly, methods and decisions behind the numbers were documented and shared, helping people understand not just what the data said, but how it came to be.
Returning to academia and behaviour change research, I saw it adopt a number of things I valued in official statistics: from contact the author footnotes to full transparency through platforms like the Open Science Framework (OSF), GitHub, and Zenodo. As well as a shift from a top-down mentality to one of co-creation and public engagement in collecting, managing, and releasing data.
Moreover, the Findable, Accessible, Interoperable, Reusable (FAIR) principles echoed what I had seen in official statistics, a recognition that the process matters just as much as the product (Wilkinson et al., 2016).
The more open we are with our work, the more voices are included in the discourse, which in turn can help us ensure our work remains fit for purpose, while also creating an opportunity for us to converge towards an empirical truth.
Vinayak Anand Kumar is a behavioural scientist and statistician with a background in health psychology and official statistics. As a Marie Skłodowska-Curie Actions fellow with the Health CASCADE network, he studied the use of cocreation in designing, building, and evaluating digital health interventions. His current research interests focus on open science and combining methodological rigour with creative science communication. Originally from India and raised in Aotearoa New Zealand, Vinayak now lives in Germany and is a Guest Researcher at Constructor University.
Upon completing my PhD, I was inspired to share my work with people outside academia, my friends, family, and the curious. My goal was to open up my work to new audiences and invite questions and critique.
We are in an era where people feel more empowered to question and more willing to challenge long-standing authorities on a topic. This presents us with a new challenge: something to push us, for us to grow beyond just informing. To build trust in our research and bridge the gap between academia and the communities we are trying to reach, we have to look for ways to connect with meaningful language that provokes questions and invites critique.
Varthai is a personal website, presenting my research through art, poetry, and data visualisation. The word Varthai comes from the Tamil language, meaning word. I wanted to use different words, in the metaphorical sense, to speak to my audience; to draw them into my work. My goal is to present every study using an art piece, a poem, and a series of data visuals.
People can start with the dissemination method that they find most engaging and then go deeper. For example, clicking Art reveals the full art piece and directs viewers to a Wikimedia Commons page that presents the topics covered in the study.
The audience is also presented with the first word of a poem. When clicking it, they are shown the full poem with a link to the publication.
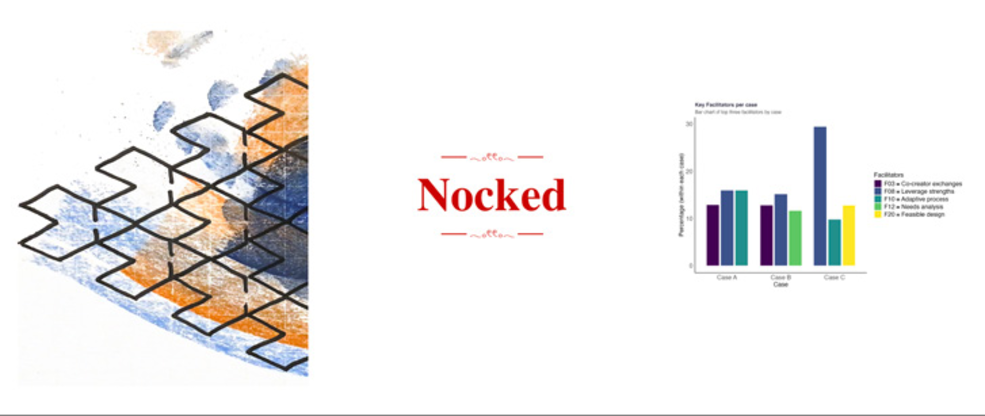
Finally, a data visualisation is presented to the user, which, when clicked, reveals either a larger version or a full range of the data visualisation, as well as a link to the OSF repository with details of the methods used to collect, process and analyse data, along with corresponding syntax.
Varthai exists to both share my work and invite critique. It aligns with the principles of cocreation, developed by Health CASCADE (Chastin et al., 2025), namely those of open access and transparency, providing open links to my OSF repository and using free tools, such as RStudio, Quarto, and Netlify, to construct the site. This allows others to explore the full data generation process and adapt the model for their own work. I aim to balance creativity with credibility, and welcome feedback on both the research and the platform.
Going forward, I hope to integrate more cocreation by collaborating with study participants and co-authors to develop artwork or write poems, extending the principle of recognised contribution into the dissemination phase. I also aim to further support the principle of plural evidence by exploring different ways of sharing insights, and use Binder (Jupyter et al., 2018) to increase transparency by letting users interact directly with my data processing and analysis pipelines.
Vinayak Anand Kumar
Constructor University
References:
Brackstone, G. (2008). Managing Data Quality in a Statistical Agency 1. Survey Methodology, 25.
Chastin, S. F. M., Smith, N., Agnello, D. M., An, Q., Altenburg, T. M., Balaskas, G., De Boer, J., Cardon, G., Chinapaw, M. J. M., Chrifou, R., Dall, P. M., Davis, A., Deforche, B., Delfmann, L. R., Giné-Garriga, M., Goh, K., Hunter, S. C., Leask, C. F., Lippke, S., … Wadell, K. (2025). Principles and attributes of evidence-based co-creation: From naïve praxis toward a trustworthy methodology - A Health CASCADE study. Public Health, 248, 105922. https://doi.org/10.1016/j.puhe.2025.105922
Jupyter, P., Bussonnier, M., Forde, J., Freeman, J., Granger, B., Head, T., Holdgraf, C., Kelley, K., Nalvarte, G., Osheroff, A., Pacer, M., Panda, Y., Perez, F., Ragan-Kelley, B., & Willing, C. (2018). Binder 2.0— Reproducible, interactive, sharable environments for science at scale. 113–120. https://doi.org/10.25080/Majora-4af1f417-011
Wilkinson, M. D., Dumontier, M., Aalbersberg, Ij. J., Appleton, G., Axton, M., Baak, A., Blomberg, N., Boiten, J.-W., da Silva Santos, L. B., Bourne, P. E., Bouwman, J., Brookes, A. J., Clark, T., Crosas, M., Dillo, I., Dumon, O., Edmunds, S., Evelo, C. T., Finkers, R., … Mons, B. (2016). The FAIR Guiding Principles for scientific data management and stewardship. Scientific Data, 3(1), 160018. https://doi.org/10.1038/sdata.2016.18